Getting Started With APIs

the ELI5 edition, featuring plumber


2022-10-21


Katie Masiello, Solutions Engineer at


github.com/kmasiello/getting-started-apis

What is an API?

Wikipedia says:

An application programming interface (API) is a way for two or more computer programs to communicate with each other.


🤔 I’m not a computer… so what’s that got to do with me?

Katie says:

An API is just a fancy way of accessing a function, from any system, and you don’t have to access that function using the same language it was written in.

Katie’s corollary:

If you can write a function, you can write an API.

Systems as Black Boxes

Two black box systems. The left system asks for fleet data, the right system responds with data.

What’s inside my system?

  • R?
  • Python?
  • Excel?
  • Tableau?

What’s inside the other system?

  • JavaScript?
  • Python?
  • R?
  • Scratch? ;)

Systems as Black Boxes

Two black box systems. The left system asks for data, the right system responds with data.

What’s inside my system?

What’s inside the other system?


🎉
It doesn’t matter as long as we agree on a standard way to communicate between systems!

Systems as Black Boxes

Two black box systems. The left system asks for data, the right system responds with data.

If the other system’s external interfaces are exposed as “API endpoints,” and if my system can formulate a REST-based API call, we can communicate.

Let’s See it in Action 🌧️

How’s the weather at Paine Field?

https://api.open-meteo.com/v1/forecast?latitude=47.9&longitude=-122.3&hourly=temperature_2m, rain,windspeed_10m&temperature_unit=fahrenheit&windspeed_unit=mph&precipitation_unit=inch& timezone=America%2FLos_Angeles

library(httr)
httr::GET("https://api.open-meteo.com/v1/forecast?latitude=47.9&longitude=-122.3&hourly=temperature_2m,rain,windspeed_10m&temperature_unit=fahrenheit&windspeed_unit=mph&precipitation_unit=inch&timezone=America%2FLos_Angeles") |> 
  content(as = "text") |> 
  jsonlite::fromJSON()
$latitude
[1] 47.875

$longitude
[1] -122.25

$generationtime_ms
[1] 0.6719828

$utc_offset_seconds
[1] -25200

$timezone
[1] "America/Los_Angeles"

$timezone_abbreviation
[1] "PDT"

$elevation
[1] 156

$hourly_units
$hourly_units$time
[1] "iso8601"

$hourly_units$temperature_2m
[1] "°F"

$hourly_units$rain
[1] "inch"

$hourly_units$windspeed_10m
[1] "mp/h"


$hourly
$hourly$time
  [1] "2022-10-17T00:00" "2022-10-17T01:00" "2022-10-17T02:00"
  [4] "2022-10-17T03:00" "2022-10-17T04:00" "2022-10-17T05:00"
  [7] "2022-10-17T06:00" "2022-10-17T07:00" "2022-10-17T08:00"
 [10] "2022-10-17T09:00" "2022-10-17T10:00" "2022-10-17T11:00"
 [13] "2022-10-17T12:00" "2022-10-17T13:00" "2022-10-17T14:00"
 [16] "2022-10-17T15:00" "2022-10-17T16:00" "2022-10-17T17:00"
 [19] "2022-10-17T18:00" "2022-10-17T19:00" "2022-10-17T20:00"
 [22] "2022-10-17T21:00" "2022-10-17T22:00" "2022-10-17T23:00"
 [25] "2022-10-18T00:00" "2022-10-18T01:00" "2022-10-18T02:00"
 [28] "2022-10-18T03:00" "2022-10-18T04:00" "2022-10-18T05:00"
 [31] "2022-10-18T06:00" "2022-10-18T07:00" "2022-10-18T08:00"
 [34] "2022-10-18T09:00" "2022-10-18T10:00" "2022-10-18T11:00"
 [37] "2022-10-18T12:00" "2022-10-18T13:00" "2022-10-18T14:00"
 [40] "2022-10-18T15:00" "2022-10-18T16:00" "2022-10-18T17:00"
 [43] "2022-10-18T18:00" "2022-10-18T19:00" "2022-10-18T20:00"
 [46] "2022-10-18T21:00" "2022-10-18T22:00" "2022-10-18T23:00"
 [49] "2022-10-19T00:00" "2022-10-19T01:00" "2022-10-19T02:00"
 [52] "2022-10-19T03:00" "2022-10-19T04:00" "2022-10-19T05:00"
 [55] "2022-10-19T06:00" "2022-10-19T07:00" "2022-10-19T08:00"
 [58] "2022-10-19T09:00" "2022-10-19T10:00" "2022-10-19T11:00"
 [61] "2022-10-19T12:00" "2022-10-19T13:00" "2022-10-19T14:00"
 [64] "2022-10-19T15:00" "2022-10-19T16:00" "2022-10-19T17:00"
 [67] "2022-10-19T18:00" "2022-10-19T19:00" "2022-10-19T20:00"
 [70] "2022-10-19T21:00" "2022-10-19T22:00" "2022-10-19T23:00"
 [73] "2022-10-20T00:00" "2022-10-20T01:00" "2022-10-20T02:00"
 [76] "2022-10-20T03:00" "2022-10-20T04:00" "2022-10-20T05:00"
 [79] "2022-10-20T06:00" "2022-10-20T07:00" "2022-10-20T08:00"
 [82] "2022-10-20T09:00" "2022-10-20T10:00" "2022-10-20T11:00"
 [85] "2022-10-20T12:00" "2022-10-20T13:00" "2022-10-20T14:00"
 [88] "2022-10-20T15:00" "2022-10-20T16:00" "2022-10-20T17:00"
 [91] "2022-10-20T18:00" "2022-10-20T19:00" "2022-10-20T20:00"
 [94] "2022-10-20T21:00" "2022-10-20T22:00" "2022-10-20T23:00"
 [97] "2022-10-21T00:00" "2022-10-21T01:00" "2022-10-21T02:00"
[100] "2022-10-21T03:00" "2022-10-21T04:00" "2022-10-21T05:00"
[103] "2022-10-21T06:00" "2022-10-21T07:00" "2022-10-21T08:00"
[106] "2022-10-21T09:00" "2022-10-21T10:00" "2022-10-21T11:00"
[109] "2022-10-21T12:00" "2022-10-21T13:00" "2022-10-21T14:00"
[112] "2022-10-21T15:00" "2022-10-21T16:00" "2022-10-21T17:00"
[115] "2022-10-21T18:00" "2022-10-21T19:00" "2022-10-21T20:00"
[118] "2022-10-21T21:00" "2022-10-21T22:00" "2022-10-21T23:00"
[121] "2022-10-22T00:00" "2022-10-22T01:00" "2022-10-22T02:00"
[124] "2022-10-22T03:00" "2022-10-22T04:00" "2022-10-22T05:00"
[127] "2022-10-22T06:00" "2022-10-22T07:00" "2022-10-22T08:00"
[130] "2022-10-22T09:00" "2022-10-22T10:00" "2022-10-22T11:00"
[133] "2022-10-22T12:00" "2022-10-22T13:00" "2022-10-22T14:00"
[136] "2022-10-22T15:00" "2022-10-22T16:00" "2022-10-22T17:00"
[139] "2022-10-22T18:00" "2022-10-22T19:00" "2022-10-22T20:00"
[142] "2022-10-22T21:00" "2022-10-22T22:00" "2022-10-22T23:00"
[145] "2022-10-23T00:00" "2022-10-23T01:00" "2022-10-23T02:00"
[148] "2022-10-23T03:00" "2022-10-23T04:00" "2022-10-23T05:00"
[151] "2022-10-23T06:00" "2022-10-23T07:00" "2022-10-23T08:00"
[154] "2022-10-23T09:00" "2022-10-23T10:00" "2022-10-23T11:00"
[157] "2022-10-23T12:00" "2022-10-23T13:00" "2022-10-23T14:00"
[160] "2022-10-23T15:00" "2022-10-23T16:00" "2022-10-23T17:00"
[163] "2022-10-23T18:00" "2022-10-23T19:00" "2022-10-23T20:00"
[166] "2022-10-23T21:00" "2022-10-23T22:00" "2022-10-23T23:00"

$hourly$temperature_2m
  [1] 49.0 48.1 47.3 46.8 46.3 45.4 44.8 44.1 43.6 48.8 56.0 60.3 62.7 64.6 65.7
 [16] 65.7 64.6 62.6 58.7 55.2 53.5 52.1 50.5 49.2 48.1 47.8 47.6 47.2 46.3 45.0
 [31] 44.3 44.2 44.5 45.2 50.3 56.2 60.6 62.3 63.6 64.5 64.5 63.3 59.2 55.5 53.9
 [46] 51.7 50.9 49.6 48.4 47.7 47.2 45.6 44.5 44.2 44.3 45.3 46.0 47.3 49.6 53.6
 [61] 57.0 59.5 61.0 61.9 61.5 59.9 56.2 52.6 51.1 50.3 49.5 47.9 47.2 46.9 45.6
 [76] 46.4 47.2 47.1 47.0 46.7 46.9 48.8 54.1 59.6 60.3 59.8 58.7 58.2 57.7 56.9
 [91] 56.2 55.5 54.7 54.2 53.6 53.2 53.2 53.5 53.3 52.3 50.9 49.3 48.6 48.1 48.0
[106] 48.5 49.5 50.5 50.8 50.8 50.7 50.2 49.6 48.8 48.2 47.8 47.2 46.8 46.4 46.2
[121] 46.1 46.0 45.9 45.8 45.7 45.6 45.5 45.4 45.4 45.5 45.9 46.6 47.6 48.9 49.9
[136] 50.1 49.9 48.9 47.5 45.8 43.5 41.9 40.5 39.1 38.5 38.3 38.1 37.5 36.9 36.4
[151] 36.1 36.0 37.3 40.1 44.0 48.5 50.5 51.7 52.7 52.8 52.3 51.4 50.6 49.7 48.6
[166] 48.1 47.6 47.2

$hourly$rain
  [1] 0.000 0.000 0.000 0.000 0.000 0.000 0.000 0.000 0.000 0.000 0.000 0.000
 [13] 0.000 0.000 0.000 0.000 0.000 0.000 0.000 0.000 0.000 0.000 0.000 0.000
 [25] 0.000 0.000 0.000 0.000 0.000 0.000 0.000 0.000 0.000 0.000 0.000 0.000
 [37] 0.000 0.000 0.000 0.000 0.000 0.000 0.000 0.000 0.000 0.000 0.000 0.000
 [49] 0.000 0.000 0.000 0.000 0.000 0.000 0.000 0.000 0.000 0.000 0.000 0.000
 [61] 0.000 0.000 0.000 0.000 0.000 0.000 0.000 0.000 0.000 0.000 0.000 0.000
 [73] 0.000 0.000 0.000 0.000 0.000 0.000 0.000 0.000 0.000 0.000 0.000 0.000
 [85] 0.000 0.000 0.000 0.000 0.000 0.000 0.000 0.000 0.000 0.000 0.000 0.000
 [97] 0.008 0.008 0.008 0.000 0.000 0.000 0.000 0.000 0.000 0.000 0.000 0.000
[109] 0.020 0.020 0.020 0.024 0.024 0.024 0.012 0.012 0.012 0.004 0.004 0.004
[121] 0.000 0.000 0.000 0.004 0.004 0.004 0.043 0.043 0.043 0.063 0.063 0.063
[133] 0.008 0.008 0.008 0.000 0.000 0.000 0.000 0.000 0.000 0.000 0.000 0.000
[145] 0.000 0.000 0.000 0.000 0.000 0.000 0.000 0.000 0.000 0.000 0.000 0.000
[157] 0.000 0.000 0.000 0.000 0.000 0.000 0.004 0.004 0.004 0.008 0.008 0.008

$hourly$windspeed_10m
  [1] 3.5 3.1 2.9 2.6 2.5 2.7 2.4 2.2 2.4 1.7 1.6 3.4 3.7 3.0 2.9 3.4 3.2 3.4
 [19] 2.4 2.1 2.3 2.2 1.7 1.4 1.4 1.6 1.6 1.6 1.6 2.1 1.5 1.0 0.8 0.9 1.0 2.1
 [37] 3.7 4.9 5.1 5.1 4.4 3.8 2.4 1.6 2.7 2.2 1.6 1.8 1.8 1.6 3.6 2.1 1.3 1.1
 [55] 0.2 1.0 1.3 1.1 1.6 3.0 3.6 4.7 5.4 5.4 5.5 4.0 2.9 2.6 2.1 2.6 3.1 2.1
 [73] 0.3 0.9 1.6 1.6 2.0 1.4 2.5 1.8 3.2 0.9 1.0 3.2 2.1 2.2 3.6 2.9 1.6 1.3
 [91] 1.6 2.4 3.5 3.2 2.6 2.1 1.8 2.4 3.8 4.0 3.8 3.5 3.6 3.8 4.3 4.4 4.6 4.7
[109] 4.2 3.0 2.2 2.6 3.4 4.0 3.9 3.6 3.8 3.8 3.7 3.5 3.3 3.2 2.9 2.8 2.4 2.1
[127] 2.0 1.8 2.0 2.0 2.1 1.8 1.6 1.2 0.9 0.2 0.9 1.6 0.9 0.7 2.1 2.4 2.2 2.1
[145] 2.1 2.2 2.2 2.2 2.4 2.6 2.6 2.8 3.2 4.0 5.4 6.9 7.7 8.3 8.8 8.1 7.2 6.4
[163] 6.7 7.3 8.0 8.2 8.4 8.4

Think of APIs as a way to access functions

General form of an API:

http://hostname/api_endpoint/?parameter=value

Example function:

my_function <- function(argument) {
  some_kind_of_operation(argument)
}

As an API:

http://hostname/my_function/?argument=value

Parts of an API

  • Host:
    • http://api.hostname.io/
  • Endpoint:
    • Resource location (think of this as the function)
    • http://api.hostname.io/endpoint
  • Parameters (optional):
    • Address varying parts of a request (think of these as the arguments)
    • http://api.hostname.io/endpoint/?param1=valueA&param2=valueB
  • Headers & body (optional):
    • (not in URL) Associated (meta)data

The weather API:

https://api.open-meteo.com/v1/forecast?latitude=47.9&longitude=-122.3& hourly=temperature_2m,rain,windspeed_10m&temperature_unit=fahrenheit& windspeed_unit=mph&precipitation_unit=inch&timezone=America%2FLos_Angeles

API Requests

  • Each API endpoint has a different method

  • GET

    • Used to retrieve data. Parameters only. No body.
    • Everything is in the URL.
    • Don’t send sensitive data!
  • POST

    • Used for sending data (files or text).
    • Creating or modifying something.
  • Other methods:

    • PUT
    • DELETE (yikes!) ☠️
    • HEAD
    • and more

API Reponses

  • Default response from an API is JSON object

    • Human-readable (to an extent)
    • Familiar syntax for working with in R, Python
  • Many frameworks support additional response types

    • text, csv
    • images
    • htmlwidgets
    • specific file types (e.g., RDS, feather, parquet)
    • and more

Why Should You Build an API?

What’s in your data science toolbox right now?

  • Reports

  • Presentations

  • Spreadsheets

  • Interactive Dashboards

all these tools are limited to end user consumption


😄 “I can enable an analytics pipeline with APIs.”

Why Should You Build an API?

Common pain points

  • “I’ve created a Shiny beast!”

  • “We are replicating work in every project”

  • “How do we share this code with another system / group?”

  • “Your model is great, we’re going to hand it over to this other team to rebuild it in JavaScript.” 😭

Okay, but how?

API frameworks

  • R — plumber

  • Python — Flask, FastAPI

  • JavaScript — Node.js, Express.js

Deployment options

  • RStudio Connect

  • Digital Ocean

  • Docker

Our Chosen Tools for Today

API frameworks

  • R — plumber

  • Python — Flask, FastAPI

  • JavaScript — Node.js, Express.js

Deployment options

  • RStudio Connect

  • Digital Ocean

  • Docker

Let’s Get to Work!

4
steps to making a plumber API


1. Make a function

2. Add plumber decorations

3. ⚠️Save as plumber.r

4. Publish

Start Simple: A coin toss example

Function 1: coin toss

#Function 1: toss once and give me a heads or tails output 
coin_toss <- function() {
  sample(c("heads", "tails"), 1, 
         prob = c(0.5, 0.5), replace = TRUE)
}
coin_toss()
[1] "heads"

Function 2: multi toss

#Function 2: toss multiple times and summarize output
multi_toss <- function(n) {
  table(sample(c("heads", "tails"), n, 
               prob = c(0.5, 0.5), replace = TRUE)) |> 
    as.data.frame()
}
multi_toss(500)
   Var1 Freq
1 heads  239
2 tails  261


Get Ready to Decorate!

Sneak Peek: The Finished API

Notice special plumber comments (decorations) with #*

library(plumber)

#* @apiTitle Coin Toss API

#* Toss a coin once and give the result
#* @get /coin_toss

function() {
  sample(c("heads", "tails"), 1, 
         prob = c(0.5, 0.5), replace = TRUE)
}

#* Toss a coin multiple times and summarize output
#* @param n the number of times to toss the coin
#* @get /multi_toss

function(n) {
  as.data.frame(
    table(sample(c("heads", "tails"), n, 
                 prob = c(0.5, 0.5), replace = TRUE)))
  }

Make an API — Add a Title

Noted with @apiTitle

library(plumber)

#* @apiTitle Coin Toss API

#* Toss a coin once and give the result
#* @get /coin_toss

function() {
  sample(c("heads", "tails"), 1, 
         prob = c(0.5, 0.5), replace = TRUE)
  }

#* Toss a coin multiple times and summarize output
#* @param n the number of times to toss the coin
#* @get /multi_toss

function(n) {
  as.data.frame(
    table(sample(c("heads", "tails"), n, 
                 prob = c(0.5, 0.5), replace = TRUE)))
  }

Make an API — Add Endpoint Descriptions

What does each endpoint (think: function) do?

library(plumber)

#* @apiTitle Coin Toss API

#* Toss a coin once and give the result
#* @get /coin_toss

function() {
  sample(c("heads", "tails"), 1, 
         prob = c(0.5, 0.5), replace = TRUE)
}

#* Toss a coin multiple times and summarize output
#* @param n the number of times to toss the coin
#* @get /multi_toss

function(n) {
  as.data.frame(
    table(sample(c("heads", "tails"), n, 
                 prob = c(0.5, 0.5), replace = TRUE)))
}

Make an API — Add Endpoint Parameters

Noted with @param; these are your function arguments (optional)

library(plumber)

#* @apiTitle Coin Toss API

#* Toss a coin once and give the result
#* @get /coin_toss

function() {
  sample(c("heads", "tails"), 1, 
         prob = c(0.5, 0.5), replace = TRUE)
}

#* Toss a coin multiple times and summarize output
#* @param n the number of times to toss the coin
#* @get /multi_toss

function(n) {
  as.data.frame(
    table(sample(c("heads", "tails"), n, 
                 prob = c(0.5, 0.5), replace = TRUE)))
}

Make an API — Specify Endpoint and Method

Noted with @get, @post, etc.

library(plumber)

#* @apiTitle Coin Toss API

#* Toss a coin once and give the result
#* @get /coin_toss

function() {
  sample(c("heads", "tails"), 1, 
         prob = c(0.5, 0.5), replace = TRUE)
}

#* Toss a coin multiple times and summarize output
#* @param n the number of times to toss the coin
#* @get /multi_toss

function(n) {
  as.data.frame(
    table(sample(c("heads", "tails"), n, 
                 prob = c(0.5, 0.5), replace = TRUE)))
}

🎉
et voilà!

Short detour: The Swagger Interface

Plumber (and FastAPI) bake in a Swagger UI for interacting with your API

Publish the API

Deploy to RStudio Connect using your preferred method (push button deployment, git-backed deployment, or programmatic).

https://colorado.rstudio.com/rsc/coin_api/

Image of API deployed on Connect

Are you warmed up?

How might you use an API?

  • Standardize your data munging and other business logic

  • Pull the heavy lifting out of your Shiny app and into an API

  • Query your model from Slack, Tableau, other web apps, …

Example: Standardize Data Processing

Use case: You have a common source of fleet data and perform the same routine data cleaning and formatting as part of routine analysis.

library(nycflights13)
library(dplyr)

fleet_lookup <- function(carrier){

  carrier_tbl <- flights %>%
    select(carrier, tailnum) %>%
    distinct()

  planes %>%
    mutate(manufacturer=recode(manufacturer, "AIRBUS INDUSTRIE"="AIRBUS",
                    "MCDONNELL DOUGLAS CORPORATION" = "MCDONNELL DOUGLAS",
                    "MCDONNELL DOUGLAS AIRCRAFT CO" = "MCDONNELL DOUGLAS")) %>%
    filter(engine %in% c("Turbo-jet", "Turbo-fan")) %>%
    left_join(carrier_tbl) %>%
    distinct() %>%
    filter( carrier == {{ carrier }}) %>%
    group_by(manufacturer, model) %>%
    tally() %>%
    arrange(desc(n))

}

fleet_lookup("UA")
# A tibble: 17 × 3
# Groups:   manufacturer [2]
   manufacturer model         n
   <chr>        <chr>     <int>
 1 BOEING       737-824     122
 2 AIRBUS       A320-232     97
 3 BOEING       757-222      80
 4 BOEING       737-924ER    75
 5 AIRBUS       A319-131     55
 6 BOEING       757-224      41
 7 BOEING       737-724      32
 8 BOEING       767-322      32
 9 BOEING       767-424ER    16
10 BOEING       737-924      12
11 BOEING       757-33N      12
12 BOEING       757-324       9
13 BOEING       777-222       4
14 BOEING       777-224       4
15 BOEING       787-8         4
16 BOEING       767-224       2
17 BOEING       737-524       1

Use case: Your data visualization would be valuable to import into multiple reports.

library(nycflights13)
library(dplyr)
library(ggplot2)
library(ggiraph)

fleet_plot <- function(carrier){
p <- fleet_lookup({{ carrier }}) %>%
  ggplot(aes(x=model, y=n, fill = manufacturer)) +
  geom_bar_interactive(stat="identity", aes(tooltip = n, data_id = n)) +
  theme_minimal() +
  theme(legend.position="bottom") +
  scale_fill_brewer(palette="Dark2") +
  labs(title=paste({{ carrier }},"fleet data from `nycflights13`"),
       subtitle="Turbo-fan and Turbo-props only") +
  coord_flip()
girafe(code = print(p))
}

fleet_plot("UA")

Make an API

library(plumber)
library(nycflights13)
library(dplyr)
library(ggplot2)
library(ggiraph)

#* @apiTitle Fleet Lookup
#* @apiDescription Plumber example looking up fleet data from `nycflights13`

# Look 👀, I can keep my original function definition as is and I'll just call it below when defining the endpoint.
fleet_lookup <- function(carrier){
    
    carrier_tbl <- flights %>%
        select(carrier, tailnum) %>%
        distinct()
    
    planes %>%
        mutate(manufacturer=recode(manufacturer, "AIRBUS INDUSTRIE"="AIRBUS",
                                   "MCDONNELL DOUGLAS CORPORATION" = "MCDONNELL DOUGLAS",
                                   "MCDONNELL DOUGLAS AIRCRAFT CO" = "MCDONNELL DOUGLAS")) %>%
        filter(engine %in% c("Turbo-jet", "Turbo-fan")) %>%
        left_join(carrier_tbl) %>%
        distinct() %>%
        filter( carrier == {{ carrier }}) %>%
        group_by(manufacturer, model) %>%
        tally() %>%
        arrange(desc(n))
    
}

#* Look up fleet data from the `nycflights13` dataset
#* @param carrier two-letter carrier code
#* @get /fleet_lookup

function(carrier){
    
    fleet_lookup({{carrier}})
    
}


#* Plot fleet data
#* @serializer htmlwidget
#* @param carrier two-letter carrier code
#* @get /plot
function(carrier){
    p <- fleet_lookup({{ carrier }}) %>% 
        ggplot(aes(x=model, y=n, fill = manufacturer)) + 
        geom_bar_interactive(stat="identity", aes(tooltip = n, data_id = n)) + 
        theme_minimal() +
        theme(legend.position="bottom") +
        scale_fill_brewer(palette="Dark2") +
        labs(title=paste({{ carrier }},"fleet data from `nycflights13`"),
             subtitle="Turbo-fan and Turbo-props only") +
        coord_flip() 
    girafe(code = print(p))
}

What can you do now?

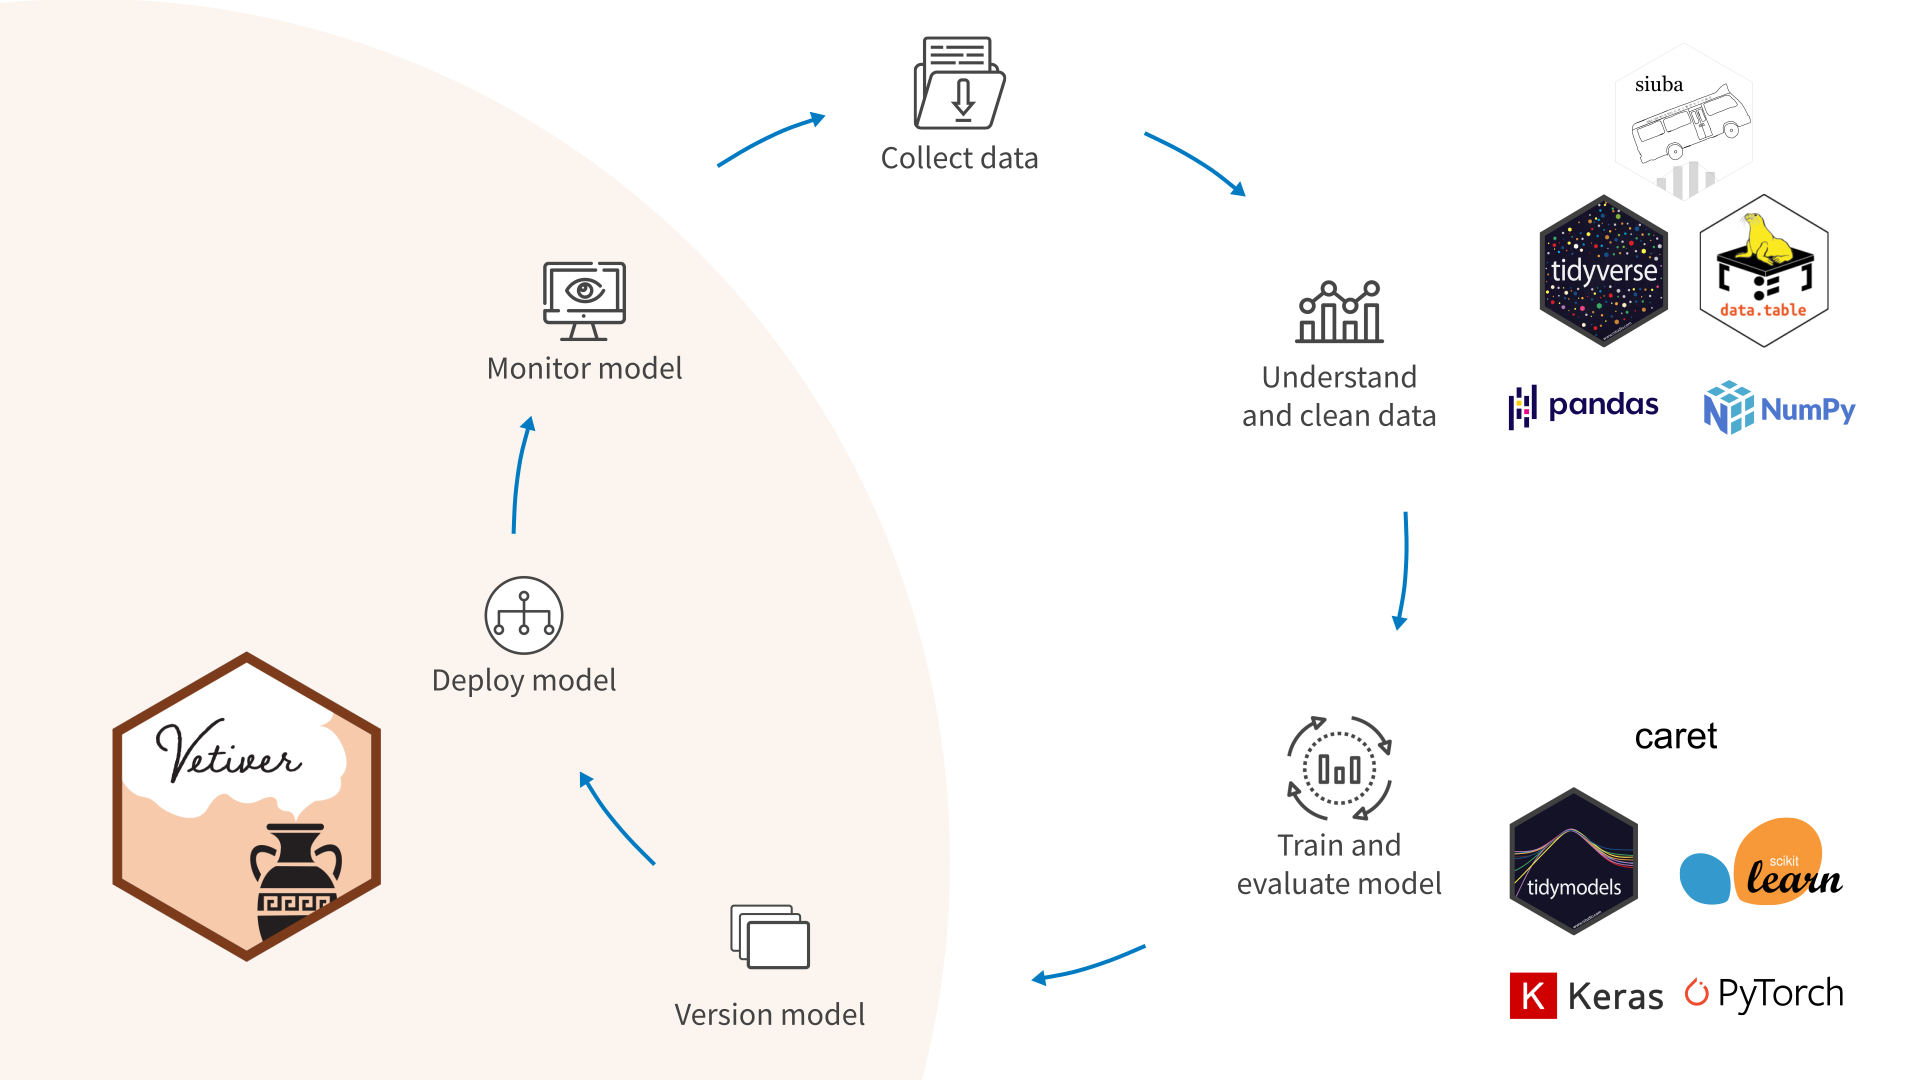
vetiver simplifies model deployment, cleverly wrapping your model as either a FastAPI or plumber API and pinning it to Connect (or Docker). Easily version your model, monitor metrics, and provide context and documentation with model cards.

plumbertableau and fastapitableau wrap your models or analytics in a Tableau-friendly API format to integrate with the Tableau Analytics Extension.

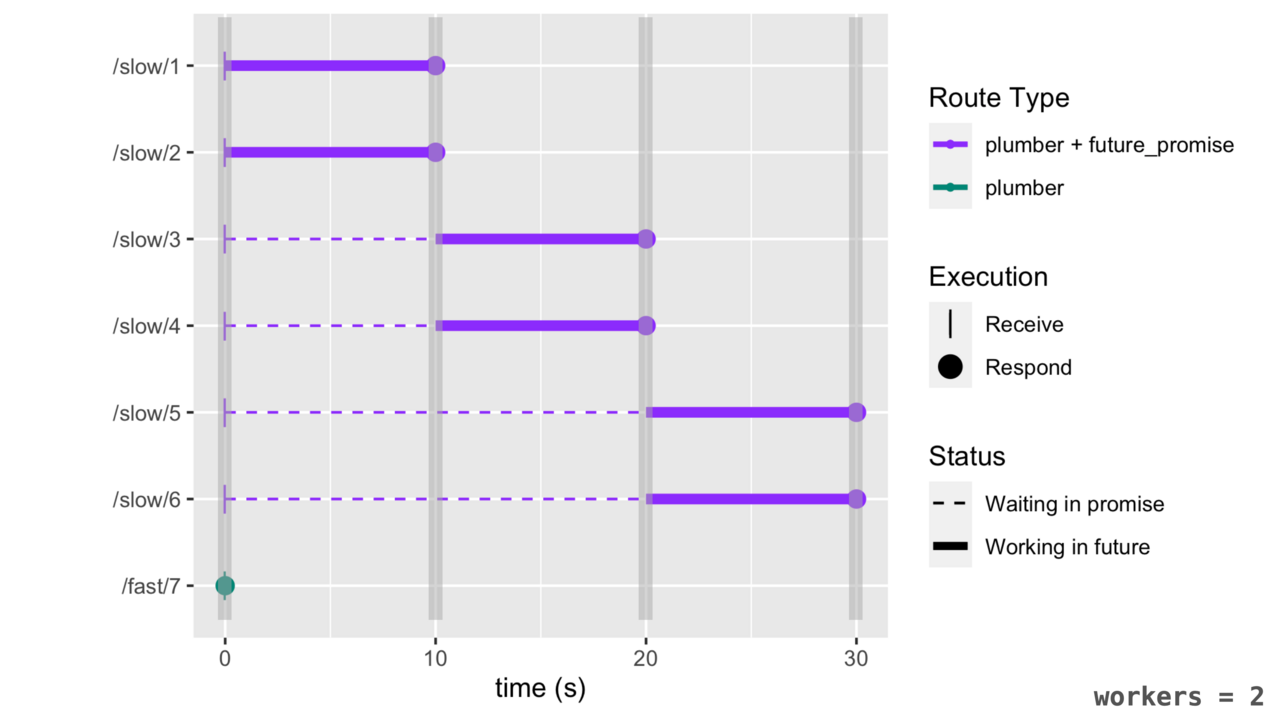
Execute multiple concurrent requests more efficiently within your plumber APIs using promises and future

Calling an API in your data science work

  • You can call an API from any system that can formulate a REST-based API request

  • In R, use httr

library()
response <- GET(query_url) %>% 
   content(as = "text") %>% jsonlite::fromJSON()
  • In Python, use requests
import requests
response = requests.get(query_url)


More detailed examples at https://solutions.rstudio.com/r/rest-apis/clients/

Resources

Thank you!